Usually we talk of sales reported in some countries but had never reviewed the major world markets , which is necessary to understand in some so the needs of manufacturers and motives that drive them to perform certain movements.
the following ranking have included the 50 countries most important by volume with registrations recorded last year . Are data on passenger vehicles, ie passenger cars, SUVs, crossovers, MPVs and sports but not light commercials included.
First as usual is China that has established itself strongly with more than 20 million units and almost tripling the second-ranked United States. This happens to not include trade since with them added distances are lower.
TOP 50 WORLD MARKETS 2015
- China 21146320
- US 7,572,662
- Japan 4215889
- Germany 3206042
- India 2772745
- UK 2633503
- Brazil 2122956
- France 1,917,226
- Italy 1575524
- South Korea 1533670
- Russia 1285366
- Spain 1.094.77
- Iran 1055400
- Mexico 892 194
- Indonesia 755 566
- Turkey 725596
- Canada 713 058
- Saudi Arabia 672 300
- Malaysia 591 298
- Australia 515683
- Belgium 501 066
- Netherlands 449 350
- Argentina 431 097
- South Africa 412 670
- Poland 354 975
- Sweden 345 108
- Switzerland 323 783
- Austria 308 555
- Thailand 304 872
- Egypt 258,400
- Israel 247,300
- Colombia 236,800
- Rep. Czech 230,857
- United Arab Emirates 214 002
- Taiwan 212 236
- Chile 212 023
- Denmark 207 717
- Pakistan 182231
- Portugal 178 503
- Norway 150 686
- Peru 131 728
- Ireland 124 945
- Kuwait 124,200
- Oman 121,100
- Morocco 120875
- Vietnam 117 288
- Philippines 116 381
- Algeria 134,100
- Finland 108 812
- Romania 98325
surprised by the bad figures of Russia that used to be much higher and also Brazil . In both cases the recession they are going through have caused longer have much weight. In the Middle East the figures for those unfamiliar with the region, are excellent and that is precisely where Toyota manages to win a high number of sales, plus in some African countries.
TOP 30 COMMERCIAL MARKETS 2015
- United States 9,897. 997
- China 3451263
- Canada 1226891
- Japan 830 622
- India 652591
- Australia 639725
- Thailand 492 707
- Mexico 459 454
- Brazil 446020
- France 427 903
- United Kingdom 427 866
- Germany 333 783
- South Korea 300.116
- Turkey 285598
- Indonesia 275 856
- South Africa 205 079
- Spain 182 982
- Philippines 172 228
- Argentina 174 836
- Iran 166,600
- Saudi Arabia 157.800
- Russia 153564
- Italy 149 863
- Vietnam 92516
- Chile 85,762
- Poland 77,464
- Malaysia 75376
- Egypt 73,700
- Netherlands 71.818
- Belgium 70 458
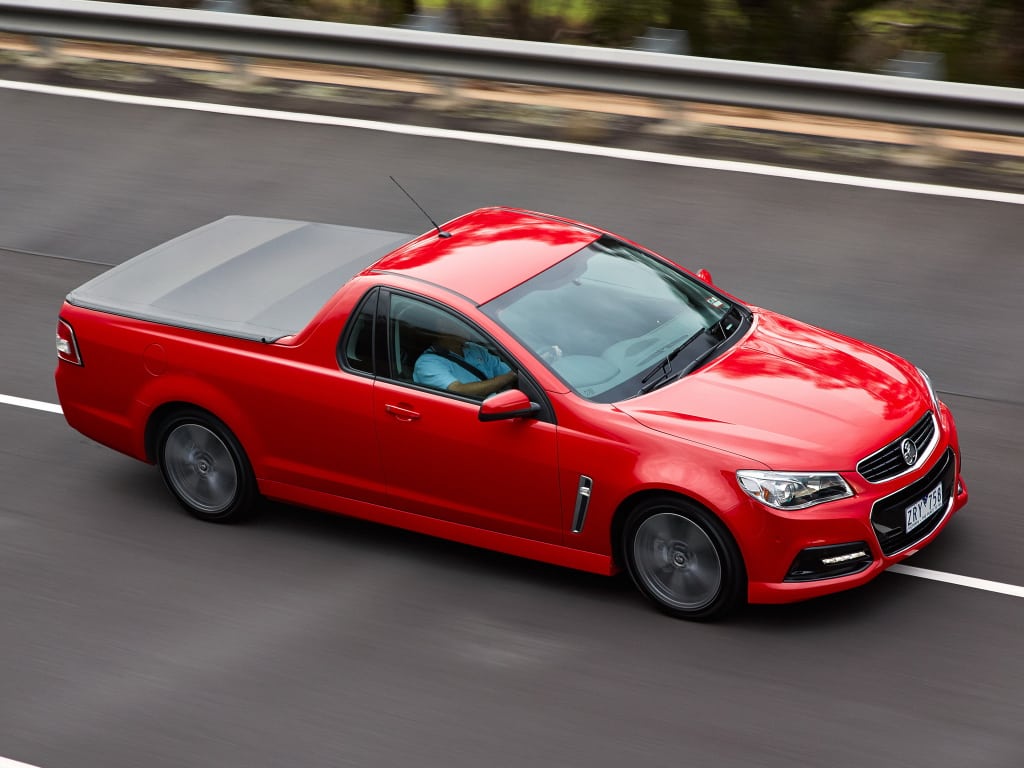
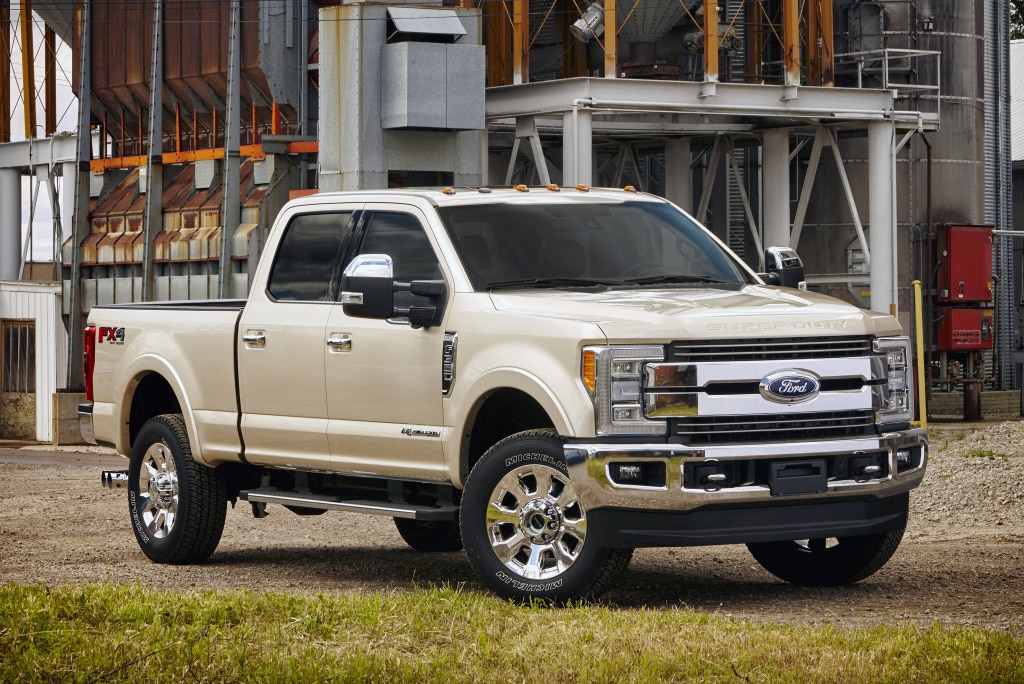
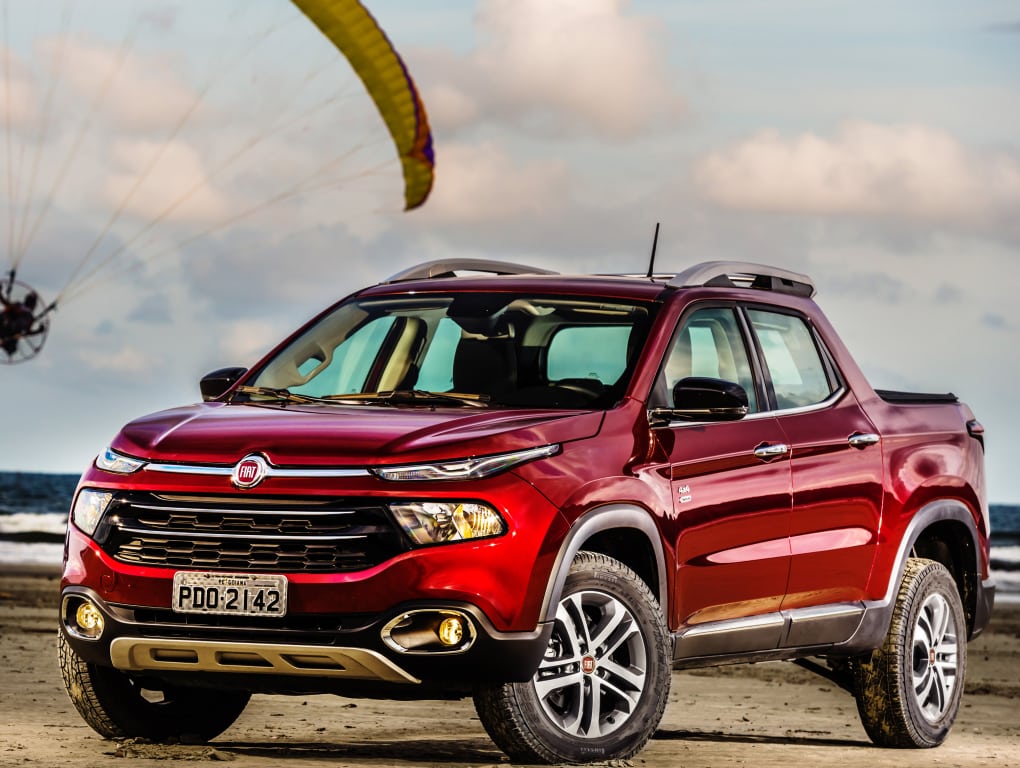
in the segment of commercial weigh heavily pick ups and there are data in the United States that make it clear that they are the kings . They also highlight the data from Thailand in which 50% of sales of total vehicles correspond to this segment.
Spain is the fourth country importance in Europe but the world is in a 17th place ranking is not bad either. the economic recession caused many sales were lost but fortunately production remains very high and between passenger cars and commercial Spain retains an excellent eighth place in the ranking producers.

ultimately this analysis you can better understand the reasons why some manufacturers make their “numbers” to balance investments various regions. Of course also they depend on tariffs, taxes, subsidies, labor, etc but that’s another story